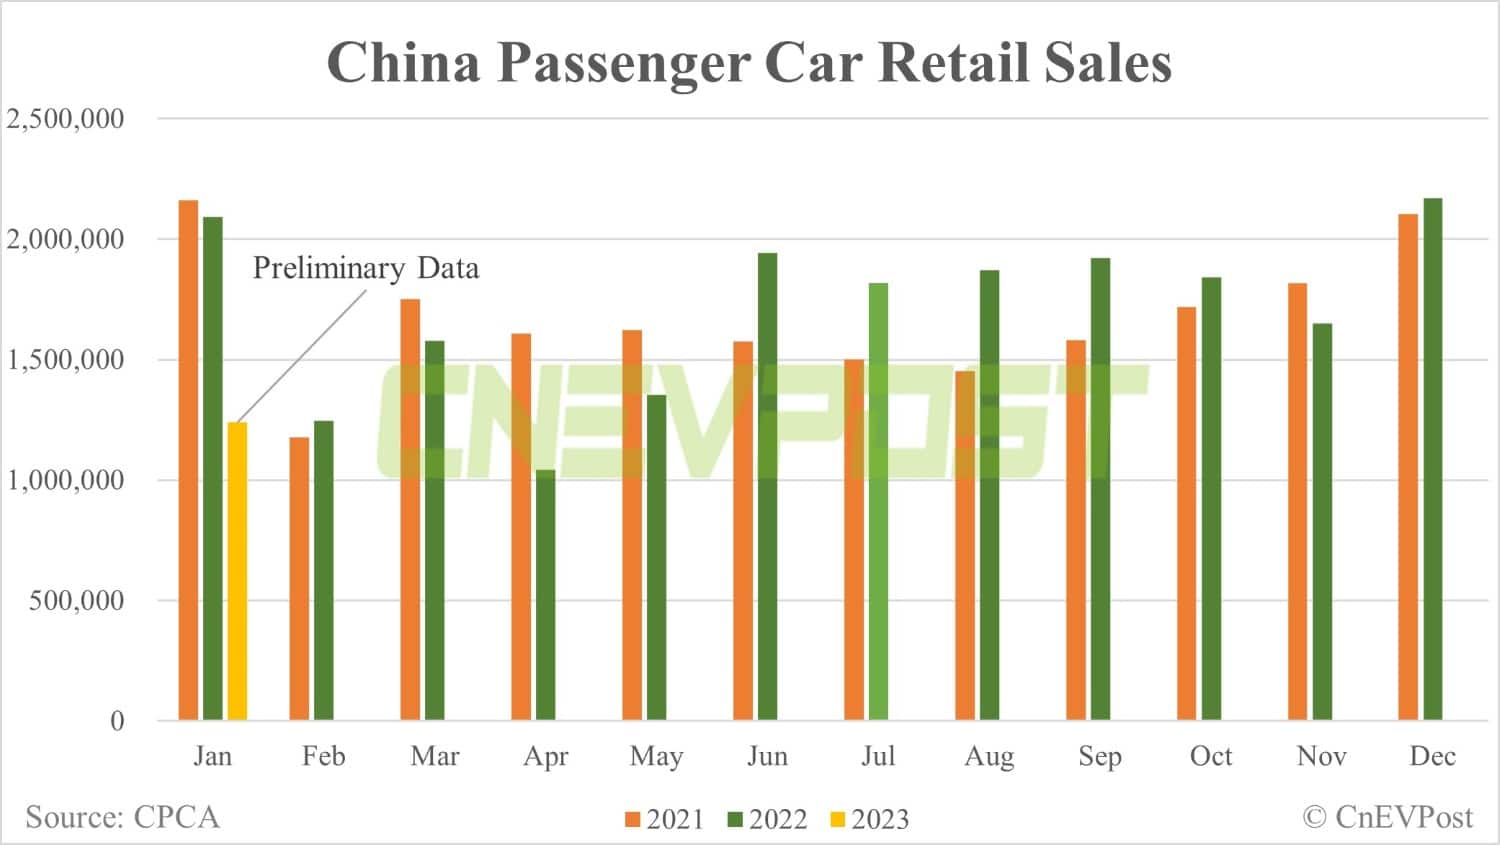
The CPCA's preliminary figures were 8.8 percent below its January 28 estimate of 1.36 million units, implying a worse-than-expected performance in the final days of January.
Sales of all passenger cars in China fell more than 40 percent in January compared to the same month last year, demonstrating the extent of the impact of the New Year holiday seasonal factor.
Chinese passenger car retail sales in January were down 41 percent year-on-year to 1.24 million units and down 43 percent from December, according to preliminary data released today by the China Passenger Car Association (CPCA).
Wholesale sales of passenger cars in China in January were 1.34 million units, down 38 percent year-on-year and down 40 percent from December, according to the data.
January 21-27 was the just-passed Chinese New Year holiday, and automakers' production and sales typically slow around the holiday. The last Chinese New Year holiday was from January 31 to February 6, 2022.
The CPCA did not mention new energy vehicle (NEV) sales in January in today's report, though its estimate released on January 28 showed that retail sales of new energy passenger vehicles in China are expected to be 360,000 units in January, up 1.8 percent year-on-year but down 43.8 percent from December.
It is worth noting that the CPCA previously estimated China's retail sales of passenger vehicles to be 1.36 million units in January, and the latest preliminary figure represents an 8.8 percent downward revision from the previous estimate, implying a worse-than-expected performance in the final days of January.
The following is the weekly performance of the Chinese passenger vehicle market in January, as announced by the CPCA today.
Daily passenger vehicle retail sales averaged 45,000 units in the first week of January, down 24 percent from a year ago but up 6 percent from the same period in December.
Average daily retail sales of passenger cars in the second week of January were 52,000 units, down 17 percent from a year ago and down 23 percent from the same period in December.
In the third to fourth weeks of January (January 16-27), passenger vehicle retail sales were 251,000 units, a daily average of 21,000 units, down 72 percent from the same period last year and down 73 percent from the same period in December.
Passenger vehicle retail sales in the fifth week of January were 271,000 units, a daily average of 68,000 units, down 10 percent year-on-year and down 39 percent from the same period in December.
China's NEV sales growth has reached a bottleneck stage, and sales growth will be a serious problem after the stimulus is withdrawn, the CPCA said, repeating a recent observation.
Too many previous price hikes and relatively small orders for NEVs, combined with price cuts by leading car companies, including Tesla, have created a wait-and-see mood among consumers, the CPCA said.
Weekly passenger car sales in China in 2023
| Period | Retail | Wholesale |
|---|---|---|
| Jan 28-31 | 271,000 | 440,000 |
| Jan 16-27 | 265,000 | 227,000 |
| Jan 9-15 | 362,000 | 329,000 |
| Jan 1-8 | 360,000 | 327,000 |
| Weekly passenger car sales in China in 2022 | ||
|---|---|---|
| Period | Retail | Wholesale |
| Dec 26-31 | 748,000 | 851,000 |
| Dec 19-25 | 633,000 | 468,000 |
| Dec 12-18 | 542,000 | 479,000 |
| Dec 1-11 | 498,000 | 466,000 |
| Nov 21-30 | 841,000 | 1,074,000 |
| Nov 21-27 | 370,000 | 472,000 |
| Nov 14-20 | 367,000 | 410,000 |
| Nov 7-13 | 278,000 | 290,000 |
| Nov 1-6 | 214,000 | 233,000 |
| Oct 24-31 | 841,000 | 1,075,000 |
| Oct 17-23 | 370,000 | 488,000 |
| Oct 8-16 | 477,000 | 472,000 |
| Sep 26-30 | 650,000 | 806,000 |
| Sep 19-25 | 465,000 | 532,000 |
| Sep 13-18 | 331,000 | 385,000 |
| Sep 1-12 | 462,000 | 526,000 |
| Aug 22-31 | 855,000 | 1,083,000 |
| Aug 22-28 | 456,000 | 502,000 |
| Aug 15-21 | 409,000 | 384,000 |
| Aug 8-14 | 331,000 | 323,000 |
| Aug 1-7 | 285,000 | 279,000 |
| Jul 25-31 | 613,000 | 878,000 |
| Jul 18-24 | 425,000 | 473,000 |
| Jul 11-17 | 335,000 | 360,000 |
| Jul 1-10 | 396,000 | 409,000 |
| Jun 27-30 | 505,000 | 607,000 |
| Jun 20-26 | 487,000 | 561,000 |
| Jun 13-19 | 416,000 | 432,000 |
| Jun 6-12 | 349,000 | 347,000 |
| Jun 1-5 | 168,000 | 163,000 |
| May 16-22 | 296,000 | 287,000 |
| May 9-15 | 230,000 | 236,000 |
| May 1-8 | 254,000 | 222,000 |
| Apr 24-30 | 442,000 | 372,000 |
| Apr 18-23 | 177,000 | 130,000 |
| Apr 11-17 | 187,000 | 158,000 |
| Apr 1-10 | 246,000 | 246,000 |
| Mar 28-31 | 438,000 | 484,000 |
| Mar 21 -27 | 274,000 | 408,000 |
| Mar 14-20 | 245,000 | 296,000 |
| Mar 7 -13 | 320,000 | 357,000 |
| Mar 1-6 | 223,000 | 239,000 |
| Feb 21 -28 | 644,000 | 710,000 |
| Feb 14-20 | 329,000 | 433,000 |
| Feb 1 -13 | 339,000 | 359,000 |
| Jan 24-31 | 529,000 | 671,000 |
| Jan 17-23 | 600,000 | 600,000 |
| Jan 10-16 | 438,000 | 403,000 |
| Jan 1-9 | 521,000 | 471,000 |

