Tesla remains the world's largest manufacturer in the BEV segment, though BYD is rapidly closing the gap with it.
Tesla (NASDAQ: TSLA) has already reported its global deliveries for the fourth quarter, and we can now start comparing how it fared against China's major EV players in 2022.
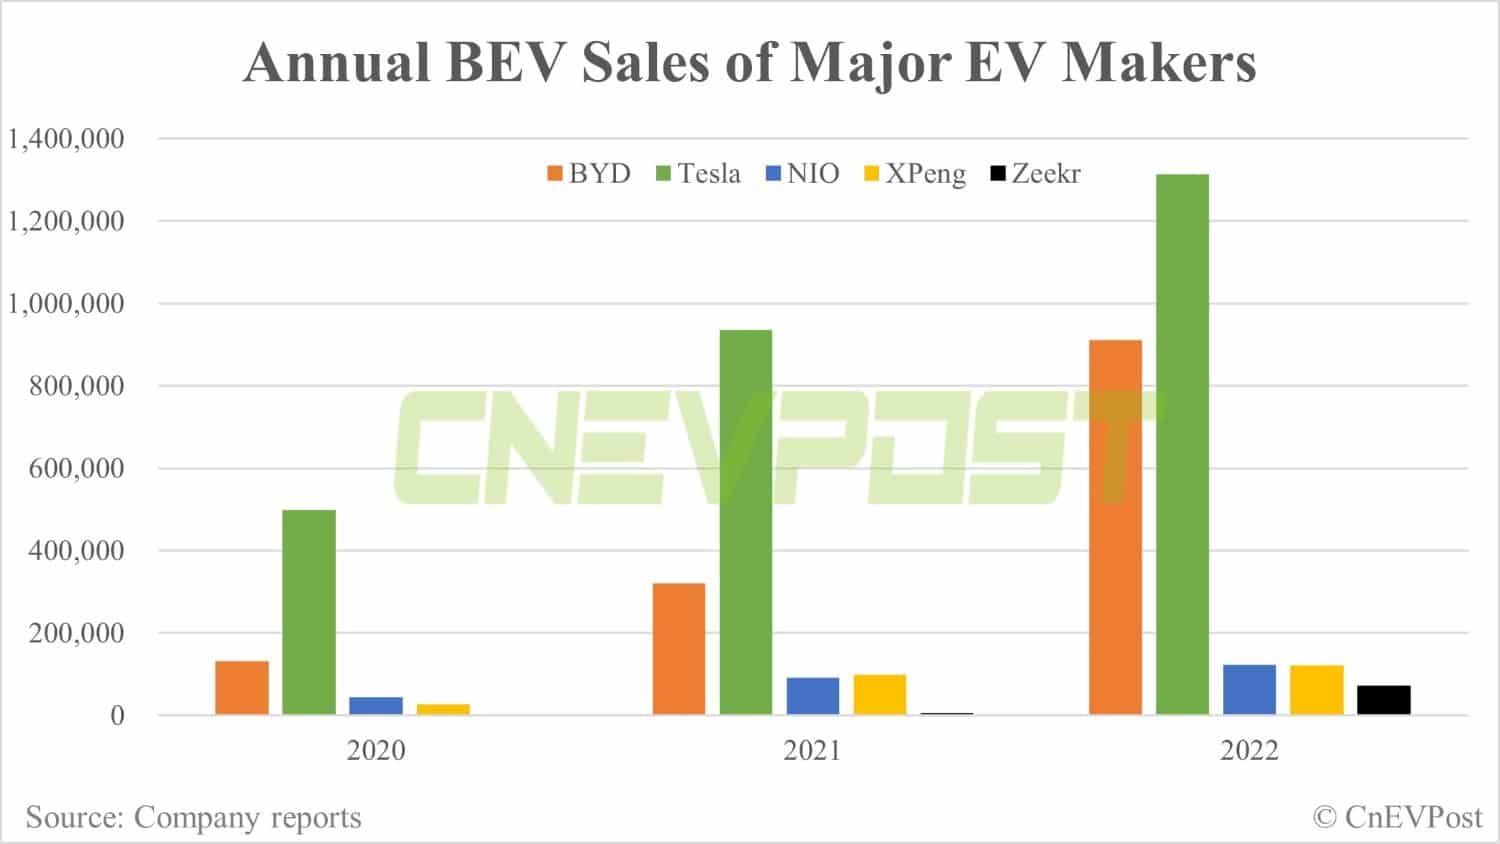
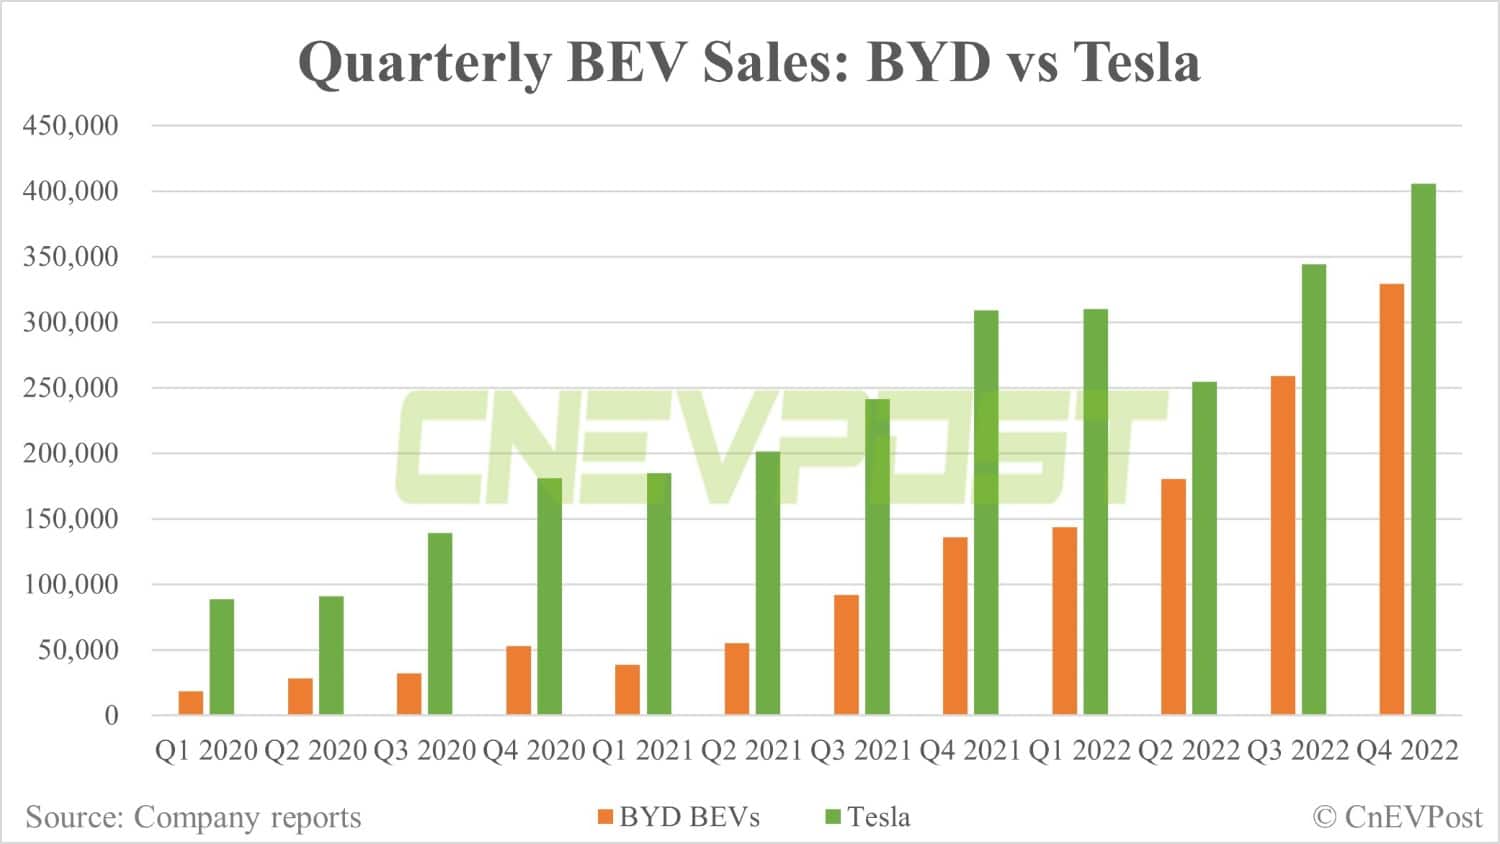
In short, Tesla remains the world's largest manufacturer in the battery electric vehicle (BEV) segment, though BYD (OTCMKTS: BYDDY) is rapidly closing the gap with it.
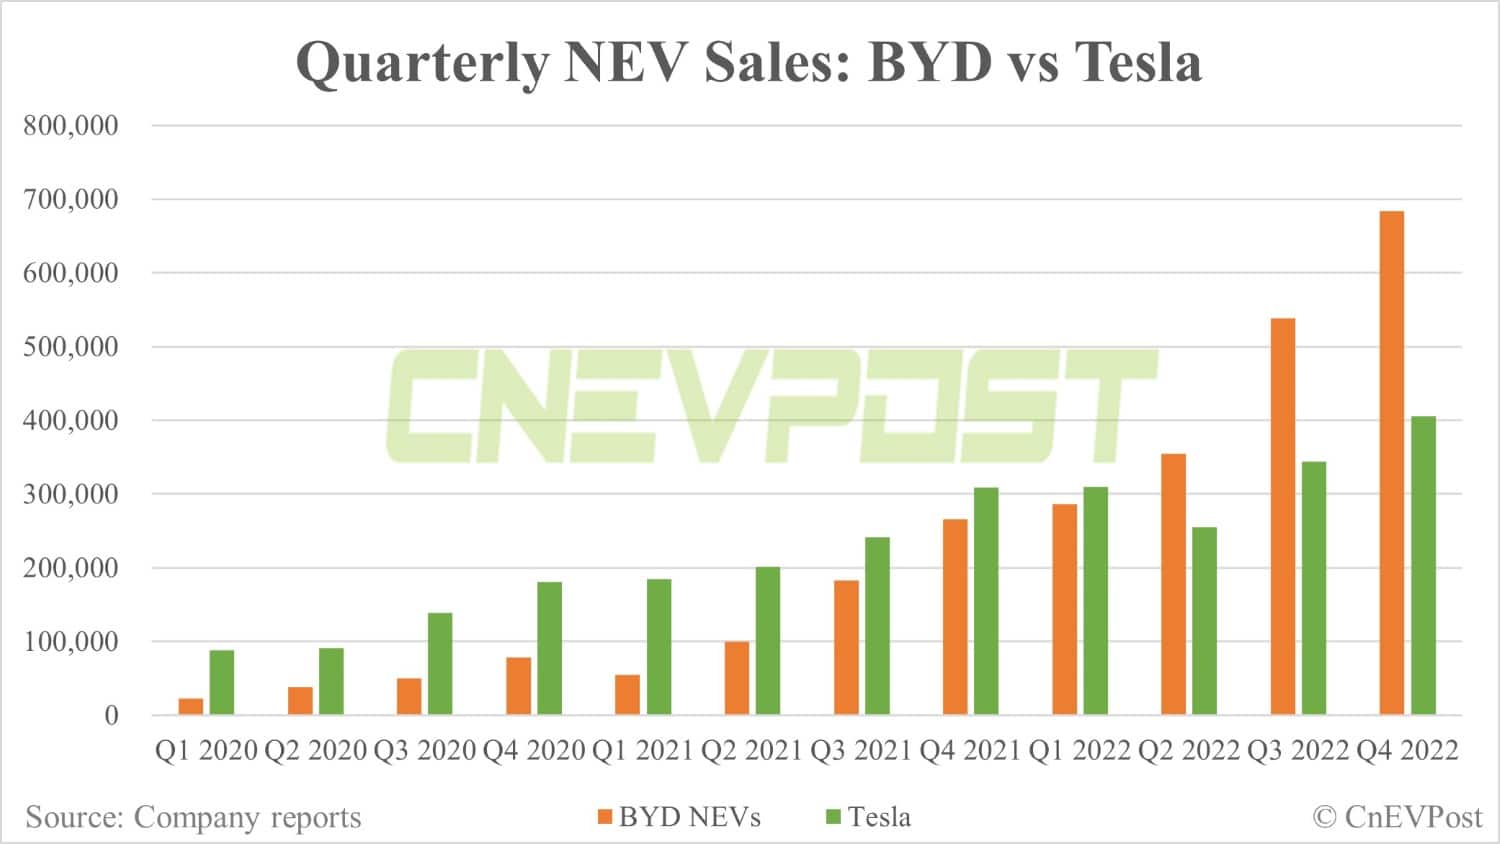
When plug-in hybrids (PHEVs) are included, BYD is the world's largest maker of NEVs, with sales well ahead of Tesla.
In 2022, Tesla delivered 1,313,851 vehicles, including 1,247,146 Model 3s and Model Ys, and 66,705 Model Ss and Model Xs.
BYD sold 911,140 BEVs in 2022, 402,711 fewer than Tesla.
Nio (NYSE: NIO) sold 122,486 vehicles in 2022, up 33.97 percent from 91,429 in 2021.
Xpeng (NYSE: XPEV) sold 120,757 vehicles in 2022, up 23.03 percent from 98,155 vehicles in 2021.
Geely's premium electric vehicle brand Zeekr sold 71,941 vehicles in 2022. The brand only started delivering vehicles in October 2021, with 6,007 deliveries in 2021.
In terms of quarterly deliveries, BYD's BEV sales were up in every quarter of 2022.
Tesla and Nio saw a decline in the second quarter due to the Covid lockdown in Shanghai, while deliveries in the other quarters maintained an upward trend.
Xpeng's deliveries in 2022 show a downward trend quarter by quarter, while Zeekr's deliveries were up every quarter.
Of the five companies, only BYD, which ceased production and sales of vehicles powered entirely by internal combustion engines in March 2021, produces both BEVs and PHEVs.
If PHEVs are included, then BYD's sales are much higher than Tesla's.
For the full year 2022, BYD's cumulative NEV sales were 1,863,494 units, up 208.64 percent from 603,783 units in the same period last year. This sales volume is 41.83 percent higher than Tesla's 2022 volume.
This article compares the performance of BYD, Tesla, Nio, Xpeng, and Zeekr in the global market. To see their BEV sales comparison in China, click here.
The Tesla sales in the tables below are global sales.
| Quarter | BYD BEVs | Tesla | Nio | Xpeng | Zeekr |
|---|---|---|---|---|---|
| Q4 2022 | 329,011 | 405,278 | 40,052 | 22,204 | 32,467 |
| Q3 2022 | 258,610 | 343,830 | 31,607 | 29,570 | 20,464 |
| Q2 2022 | 180,296 | 254,695 | 25,059 | 34,422 | 10,769 |
| Q1 2022 | 143,223 | 310,048 | 25,768 | 34,561 | 8,241 |
| Q4 2021 | 135,686 | 308,600 | 25,034 | 41,751 | 6,007 |
| Q3 2021 | 91,684 | 241,300 | 24,439 | 25,666 | |
| Q2 2021 | 54,841 | 201,250 | 21,896 | 17,398 | |
| Q1 2021 | 38,599 | 184,800 | 20,060 | 13,340 | |
| Q4 2020 | 52,621 | 180,570 | 17,353 | 12,964 | |
| Q3 2020 | 32,088 | 139,300 | 12,206 | 8,578 | |
| Q2 2020 | 28,151 | 90,650 | 10,331 | 3,228 | |
| Q1 2020 | 18,110 | 88,400 | 3,838 | 2,271 |
| Year | BYD BEVs | Tesla | Nio | Xpeng | Zeekr |
|---|---|---|---|---|---|
| 2022 | 911,140 | 1,313,851 | 122,486 | 120,757 | 71,941 |
| 2021 | 320,810 | 935,950 | 91,429 | 98,155 | 6,007 |
| 2020 | 130,970 | 498,920 | 43,728 | 27,041 | 0 |


