- Domestic NEV sales in China fell 18.9% year-on-year in January, while NEV exports doubled to a record high.
- China's total vehicle wholesale sales totaled 2.346 million units in January, down 3.2% year-on-year.
China Monthly NEV Sales (Exports Included) 2024-2026
| Month |
2024 |
2025 |
2026 |
| January |
729,000 |
944,000 |
945,000 |
| February |
477,000 |
892,000 |
|
| March |
883,000 |
1,237,000 |
|
| April |
850,000 |
1,226,000 |
|
| May |
955,000 |
1,307,000 |
|
| June |
1,049,000 |
1,329,000 |
|
| July |
991,000 |
1,262,000 |
|
| August |
1,100,000 |
1,395,000 |
|
| September |
1,287,000 |
1,604,000 |
|
| October |
1,430,000 |
1,715,000 |
|
| November |
1,512,000 |
1,823,000 |
|
| December |
1,596,000 |
1,710,000 |
|
China monthly NEV sales (exports included)
2024
2025
2026
China's January new energy vehicle (NEV) sales barely held steady with the same period, as exports remained strong despite the domestic sales decline.
In January, China's NEV sales totaled 945,000 units, falling below the 1 million mark for the first time since March 2025, according to data released today by the China Association of Automobile Manufacturers (CAAM).
This represents a 0.1% year-on-year increase but a 44.74% decrease compared to December.
CAAM's NEV sales figures represent automakers' wholesale sales, including both domestic Chinese sales and exports to overseas markets. NEVs include battery electric vehicles (BEVs), plug-in hybrid electric vehicles (PHEVs), and fuel cell vehicles.
Domestic Chinese NEV sales in January totaled 643,000 units, down 18.9% year-on-year and down 54.4% month-on-month.
China Monthly NEV Sales (Excluding Exports) 2024-2026
| Month |
2024 |
2025 |
2026 |
| January |
629,000 |
793,000 |
643,000 |
| February |
395,000 |
760,000 |
|
| March |
758,000 |
1,079,000 |
|
| April |
736,000 |
1,025,000 |
|
| May |
856,000 |
1,095,000 |
|
| June |
963,000 |
1,124,000 |
|
| July |
887,000 |
1,037,000 |
|
| August |
990,000 |
1,171,000 |
|
| September |
1,176,000 |
1,382,000 |
|
| October |
1,302,000 |
1,459,000 |
|
| November |
1,429,000 |
1,522,000 |
|
| December |
1,463,000 |
1,410,000 |
|
China NEV sales excluding exports
2024
2025
2026
This decline is primarily due to the seasonal pattern where the beginning of the year typically represents a slow period for China's auto sales, while the end of the year is usually a peak sales period.
Complicating matters further, entering 2026, Chinese NEV buyers now face a 5% purchase tax, rather than the previous full exemption from the 10% tax rate.
Additionally, vehicle trade-in subsidies expired at the end of last year. China has extended these subsidies with adjusted details, currently in a transitional phase.
NEV exports remained robust in January, reaching a record 302,000 units. This represents a 100% year-on-year increase and a 0.5% rise from December.
China Monthly NEV Exports 2024-2026
| Month |
2024 |
2025 |
2026 |
| January |
101,000 |
150,000 |
302,000 |
| February |
82,000 |
131,000 |
|
| March |
124,000 |
158,000 |
|
| April |
114,000 |
200,000 |
|
| May |
99,000 |
212,000 |
|
| June |
86,000 |
205,000 |
|
| July |
103,000 |
225,000 |
|
| August |
110,000 |
224,000 |
|
| September |
111,000 |
222,000 |
|
| October |
128,000 |
256,000 |
|
| November |
83,000 |
300,000 |
|
| December |
134,000 |
300,000 |
|
China monthly NEV exports
2024
2025
2026
Including exports, China's BEV wholesale sales in January totaled 597,000 units, up 4.0% year-on-year but down 46.12% from December.
China Monthly BEV Sales 2024-2026
| Month |
2024 |
2025 |
2026 |
| January |
445,000 |
574,000 |
597,000 |
| February |
294,000 |
544,000 |
|
| March |
566,000 |
806,000 |
|
| April |
519,000 |
822,000 |
|
| May |
583,000 |
834,000 |
|
| June |
612,000 |
859,000 |
|
| July |
551,000 |
811,000 |
|
| August |
646,000 |
908,000 |
|
| September |
775,000 |
1,058,000 |
|
| October |
842,000 |
1,109,000 |
|
| November |
908,000 |
1,170,000 |
|
| December |
973,000 |
1,108,000 |
|
China monthly BEV sales
2024
2025
2026
PHEV wholesale sales in January reached 348,000 units, down 5.9% year-on-year and down 41.9% from December.
China Monthly PHEV Sales 2024-2026
| Month |
2024 |
2025 |
2026 |
| January |
284,000 |
370,000 |
348,000 |
| February |
183,000 |
348,000 |
|
| March |
317,000 |
431,000 |
|
| April |
331,000 |
403,000 |
|
| May |
371,000 |
473,000 |
|
| June |
436,000 |
470,000 |
|
| July |
438,000 |
451,000 |
|
| August |
453,000 |
487,000 |
|
| September |
511,000 |
546,000 |
|
| October |
587,000 |
605,000 |
|
| November |
604,000 |
652,000 |
|
| December |
622,000 |
599,000 |
|
China monthly PHEV sales
2024
2025
2026
Total Chinese vehicle wholesale sales in January were 2.346 million units, down 3.2% year-on-year and down 28.3% month-on-month.
China Monthly Car Sales 2024-2026
| Month |
2024 |
2025 |
2026 |
| January |
2,439,000 |
2,423,000 |
2,346,000 |
| February |
1,584,000 |
2,129,000 |
|
| March |
2,694,000 |
2,915,000 |
|
| April |
2,359,000 |
2,590,000 |
|
| May |
2,417,000 |
2,686,000 |
|
| June |
2,552,000 |
2,904,000 |
|
| July |
2,262,000 |
2,593,000 |
|
| August |
2,453,000 |
2,857,000 |
|
| September |
2,809,000 |
3,276,000 |
|
| October |
3,053,000 |
3,322,000 |
|
| November |
3,316,000 |
3,429,000 |
|
| December |
3,489,000 |
3,272,000 |
|
China monthly car sales
2024
2025
2026
This translates to a January NEV penetration rate of 40.3%, higher than the 39.0% recorded in the same period last year but lower than December's 52.3%.
China Monthly NEV Penetration 2024-2026
| Month |
2024 |
2025 |
2026 |
| January |
29.9% |
39% |
40.3% |
| February |
30.1% |
41.9% |
|
| March |
32.8% |
42.4% |
|
| April |
36% |
47.3% |
|
| May |
39.5% |
48.7% |
|
| June |
41.1% |
45.8% |
|
| July |
43.8% |
48.7% |
|
| August |
44.8% |
48.8% |
|
| September |
45.8% |
49% |
|
| October |
46.8% |
51.6% |
|
| November |
45.6% |
53.2% |
|
| December |
45.7% |
52.3% |
|
China monthly NEV penetration
2024
2025
2026
In January, China exported 681,000 vehicles, a 44.9% year-on-year increase but a 9.5% decrease from December.
China Monthly Car Exports 2024-2026
| Month |
2024 |
2025 |
2026 |
| January |
443,000 |
470,000 |
681,000 |
| February |
377,000 |
441,000 |
|
| March |
502,000 |
507,000 |
|
| April |
504,000 |
517,000 |
|
| May |
481,000 |
551,000 |
|
| June |
485,000 |
592,000 |
|
| July |
469,000 |
575,000 |
|
| August |
511,000 |
611,000 |
|
| September |
539,000 |
652,000 |
|
| October |
542,000 |
666,000 |
|
| November |
490,000 |
728,000 |
|
| December |
504,000 |
753,000 |
|
China monthly car exports
2024
2025
2026
China exported 202,000 BEVs in January, a 100% year-on-year increase and a 16.9% rise from December.
PHEV exports totaled 99,000 units in January, up 97.3% year-on-year but down 21.8% from December.
China Monthly NEV Production 2024-2026
| Month |
2024 |
2025 |
2026 |
| January |
787,000 |
1,015,000 |
1,041,000 |
| February |
464,000 |
888,000 |
|
| March |
863,000 |
1,277,000 |
|
| April |
870,000 |
1,251,000 |
|
| May |
940,000 |
1,270,000 |
|
| June |
1,003,000 |
1,268,000 |
|
| July |
984,000 |
1,243,000 |
|
| August |
1,092,000 |
1,391,000 |
|
| September |
1,307,000 |
1,617,000 |
|
| October |
1,463,000 |
1,772,000 |
|
| November |
1,566,000 |
1,880,000 |
|
| December |
1,530,000 |
1,718,000 |
|
China monthly NEV production
2024
2025
2026
China Monthly BEV Production 2024-2026
| Month |
2024 |
2025 |
2026 |
| January |
489,000 |
635,000 |
659,000 |
| February |
280,000 |
546,000 |
|
| March |
546,000 |
838,000 |
|
| April |
535,000 |
853,000 |
|
| May |
557,000 |
820,000 |
|
| June |
580,000 |
823,000 |
|
| July |
569,000 |
807,000 |
|
| August |
646,000 |
898,000 |
|
| September |
786,000 |
1,059,000 |
|
| October |
870,000 |
1,137,000 |
|
| November |
943,000 |
1,194,000 |
|
| December |
942,000 |
1,120,000 |
|
China monthly BEV production
2024
2025
2026
China Monthly PHEV Production 2024-2026
| Month |
2024 |
2025 |
2026 |
| January |
297,000 |
380,000 |
382,000 |
| February |
183,000 |
341,000 |
|
| March |
317,000 |
439,000 |
|
| April |
334,000 |
398,000 |
|
| May |
383,000 |
449,000 |
|
| June |
422,000 |
445,000 |
|
| July |
415,000 |
436,000 |
|
| August |
445,000 |
493,000 |
|
| September |
522,000 |
558,000 |
|
| October |
593,000 |
634,000 |
|
| November |
623,000 |
684,000 |
|
| December |
588,000 |
595,000 |
|
China monthly PHEV production
2024
2025
2026
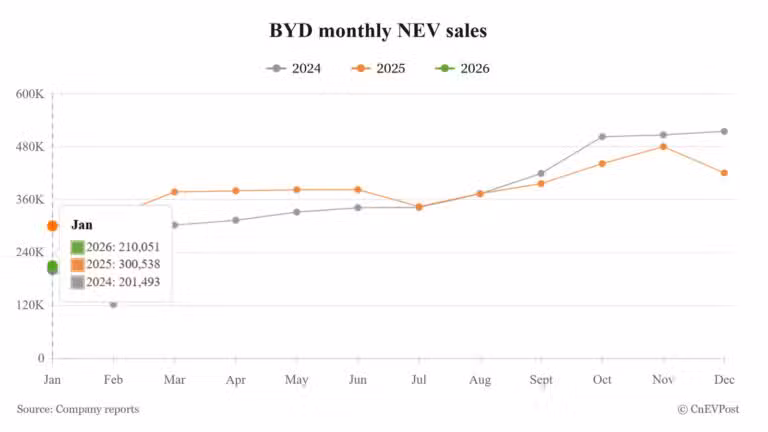
BYD exported 100,482 NEVs in January, a 51.47% increase year-on-year, marking one of the few bright spots.