
This article was first published on December 21, 2022, and was updated on January 17, 2023, as new data becomes available. It's China-only and BEV-only.
In this article, CnEVPost compares BYD's BEV sales to Tesla's retail sales in China and also shows how Nio, Xpeng, and Zeekr performed in 2022.
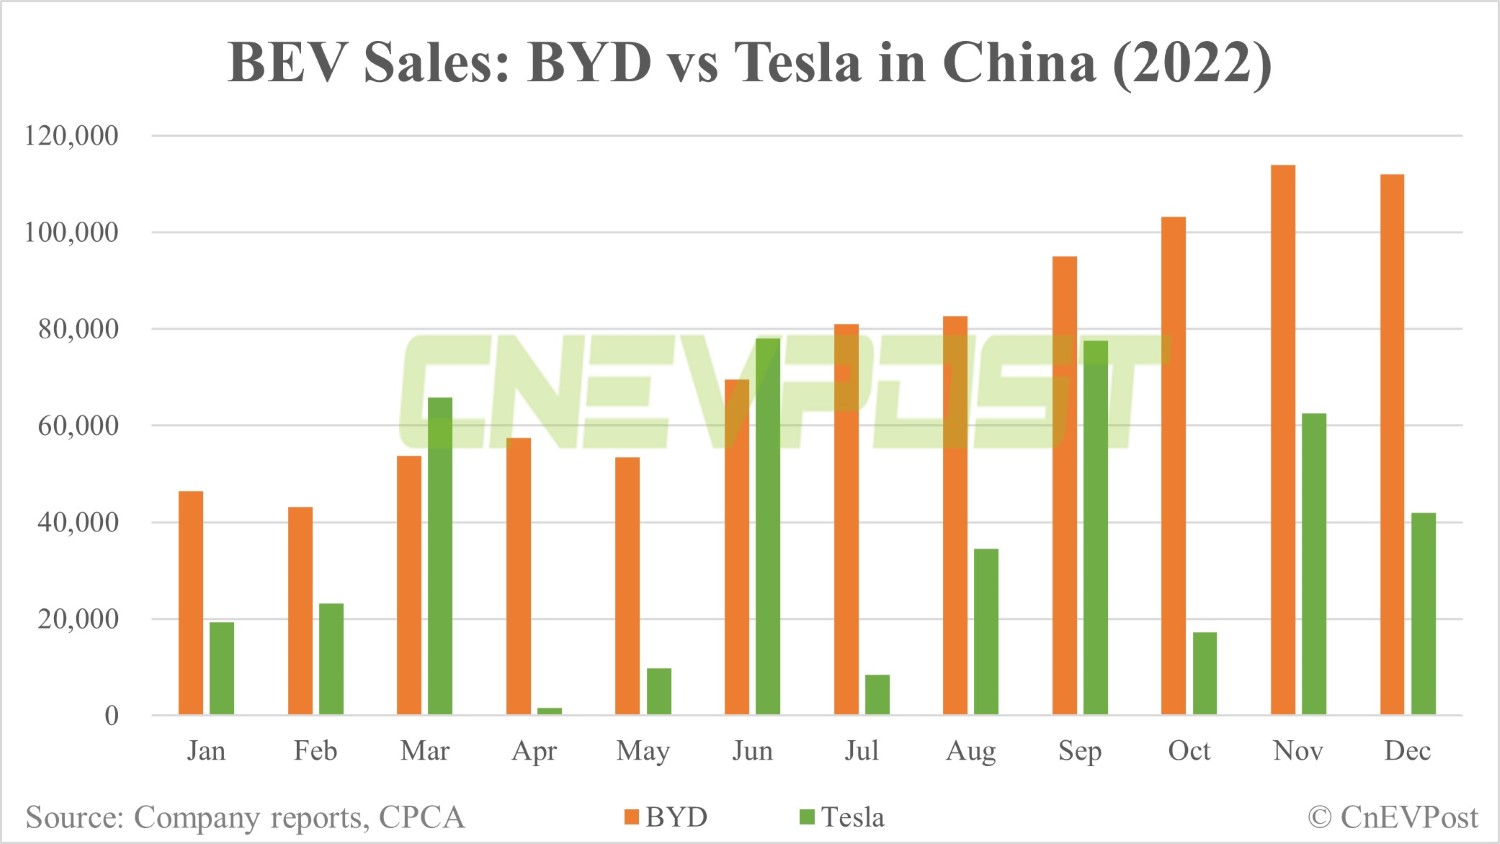
Many readers want to track the sales performance of Tesla vs BYD's battery electric vehicles (BEVs), and CnEVPost uses this article to respond to that need.
The above chart shows Tesla's retail sales in China compared to BYD's BEV sales.
BYD's sales were rising steadily, while Tesla's sales in China fluctuate greatly due to using its Shanghai plant as an export hub.
To get a better view, we also provide here a comparison of quarterly BEV sales between the two.

In terms of market share, BYD has surpassed 25 percent of the BEV market in China, while Tesla has largely fluctuated below 20 percent and was around 15 percent in November.

If we take the other major Chinese EV companies Nio, Xpeng, and Zeekr into account, then their BEV sales comparisons would be as follows.


Below are tables of BEV sales (monthly and quarterly) for these five companies in China in 2022, and CnEVPost will update the latest data as it becomes available.
Monthly sales:
| Month | BYD BEVs | Tesla | Nio | Xpeng | Zeekr |
|---|---|---|---|---|---|
| Dec | 111,939 | 41,926 | 15,815 | 11,292 | 11,337 |
| Nov | 113,915 | 62,493 | 14,178 | 5,811 | 11,011 |
| Oct | 103,157 | 17,200 | 10,059 | 5,101 | 10,119 |
| Sep | 94,941 | 77,613 | 10,878 | 8,468 | 8,276 |
| Aug | 82,678 | 34,502 | 10,677 | 9,578 | 7,166 |
| Jul | 80,991 | 8,461 | 10,052 | 11,524 | 5,022 |
| Jun | 69,544 | 77,938 | 12,961 | 15,295 | 4,302 |
| May | 53,349 | 9,825 | 7,024 | 10,125 | 4,330 |
| Apr | 57,403 | 1,512 | 5,074 | 9,002 | 2,137 |
| Mar | 53,664 | 65,754 | 9,985 | 15,414 | 1,795 |
| Feb | 43,173 | 23,200 | 6,131 | 6,225 | 2,916 |
| Jan | 46,386 | 19,346 | 9,652 | 12,922 | 3,530 |
Quarterly sales:
| Quarter | BYD BEVs | Tesla | Nio | Xpeng | Zeekr |
|---|---|---|---|---|---|
| Q4 2022 | 329,011 | 121,619 | 40,052 | 22,204 | 32,467 |
| Q3 2022 | 258,610 | 120,576 | 31,607 | 29,570 | 20,464 |
| Q2 2022 | 180,296 | 89,275 | 25,059 | 34,422 | 10,769 |
| Q1 2022 | 143,223 | 108,300 | 25,768 | 34,561 | 8,241 |
| Q4 2021 | 135,686 | 116,059 | 25,034 | 41,751 | 6,007 |
| Q3 2021 | 91,684 | 73,659 | 24,439 | 25,666 | |
| Q2 2021 | 54,841 | 61,745 | 21,896 | 17,398 | |
| Q1 2021 | 38,599 | 69,280 | 20,060 | 13,340 | |
| Q4 2020 | 52,621 | 57,551 | 17,353 | 12,964 | |
| Q3 2020 | 32,088 | 34,170 | 12,206 | 8,578 | |
| Q2 2020 | 28,151 | 29,684 | 10,331 | 3,228 | |
| Q1 2020 | 18,110 | 16,526 | 3,838 | 2,271 |
Further explanation:
One of the most commonly used words in China when talking about environmentally friendly vehicles is called new energy vehicles (NEVs). China's policy support for the industry usually covers the entire NEV industry, including BEVs, plug-in hybrids (PHEVs), and fuel cell vehicles.
In March 2022, BYD stopped producing and selling vehicles powered entirely by internal combustion engines to focus on PHEVs and BEVs.
BYD's numbers come from the company's monthly disclosures on the Hong Kong Stock Exchange. It is listed in both Hong Kong and Shenzhen.
Tesla does not publish its monthly sales performance in China, and the figures for it come from the China Passenger Car Association (CPCA).
It's worth noting that BYD's current sales model is a dealership model, so the numbers it publishes each month are for vehicles sold to dealers, i.e. wholesale sales.
The CPCA publishes BYD's retail sales figures in China each month, but only includes BYD's NEV sales, not the PHEV and BEV breakdown figures.
Therefore, to be able to compare BYD's BEV sales to Tesla's sales in China, we use the company's exchange announcement for BYD's numbers.
Note that wholesale sales are usually higher than retail sales. For BYD, its announced NEV sales over the past two months are about 6 percent higher than the CPCA's announcement of its retail sales.
In addition, BYD's exchange announcement figures include vehicles it exports, although it does not currently export much.
BYD first announced vehicle sales overseas in July 2022, with figures of 9,529 and 12,318 for October and November, respectively.


